
USDC’s Supply Soared, While USDT’s Plunged Down
According to Glassnode’s latest weekly report, as USDT has observed a large amount of redemptions recently, its supply has also been significantly reduced.
The relevant indicator here is “circulating supply,” which measures the number of coins in circulation.
The chart below shows us the trend in Tether USD supply over the last few months:
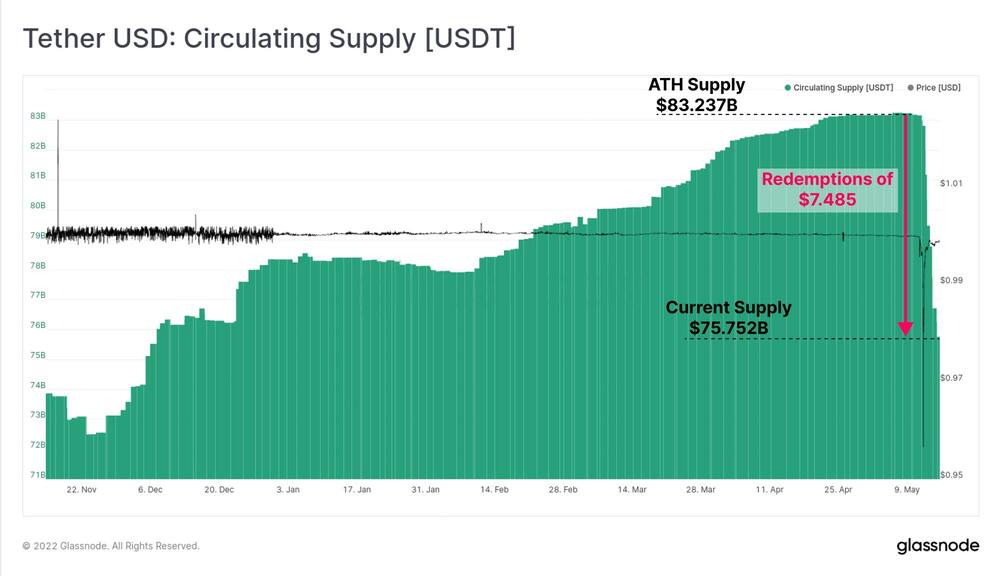
As shown in the graph above, the total USDT supply was at an all-time high of around $83 billion earlier in the month.
However, this indicator experienced a sharp decline last week as about $7.5 billion were redeemed from the coin. Tether’s total supply is now $75.7 billion.
This decrease in USDT’s supply occurred after Terra UST’s collapse, as investors may have started to pull out of the stablecoin out of fear that the same thing would happen to Tether.
The coin’s peg came under pressure as supply began to experience a sharp decline, and its price fell as low as $0.95 on May 12th.
However, it wasn’t long before the coin was back near the USD price. While this was happening, this is how USDC’s supply changed:
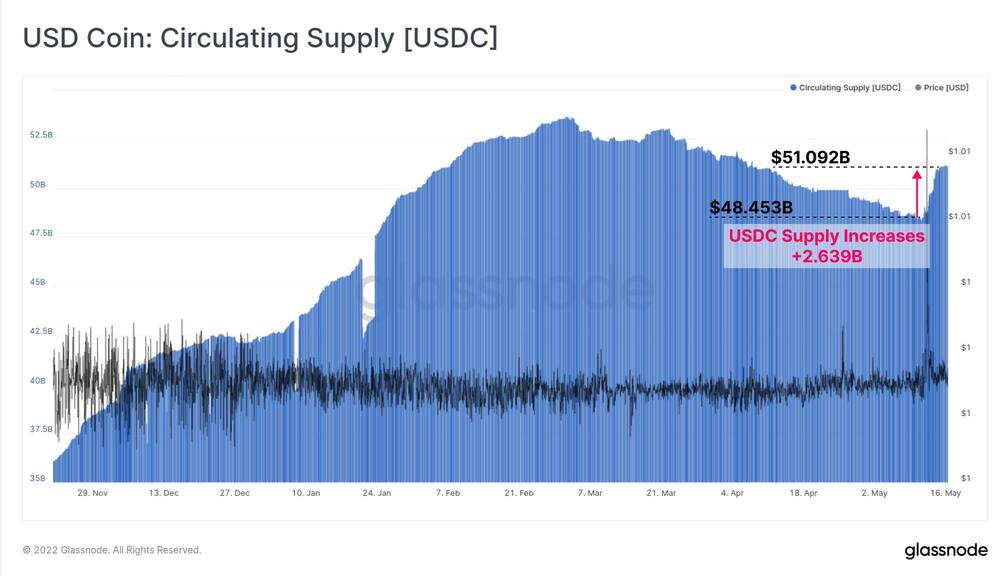
Since February of this year, the supply of USD Coin has been declining, but during the past week, the indicator has reversed course and is quickly climbing up.
Following an increase of $2.6 billion during the period, the coin’s total supply is now approximately $51 billion.
The supply trends of the two coins may indicate that investors increasingly prefer USD Coin over Tether USD during times of fear.
Bitcoin Price
Bitcoin’s price is currently hovering around $29.5k, up 4% in the last seven days. The cryptocurrency has lost 27% of its value in the previous month.
The chart below depicts the coin’s price trend over the last five days.
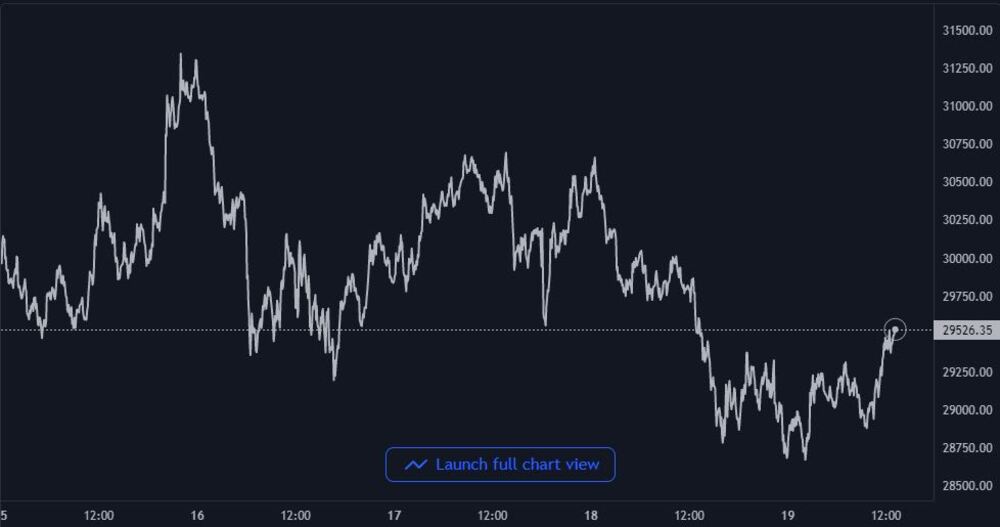
Bitcoin is still consolidating sideways around the $30k level, with no clear signs of a recovery.


