
Bitcoin (BTC) lost ground over the weekend as investors remain cautious about the United States consumer inflation data to be released on July 13. Analysts predict that the consumer price index in June will be higher than the 8.6% level recorded in May.
Due to the macro uncertainty, investors are sceptical that Bitcoin’s downturn is over. However, according to Jurrien Timmer, director of global macro at Fidelity Investments, Bitcoin is back at 2013 bull market levels “if the price per millions of non-zero addresses“ is considered for valuing it. That implies that “Bitcoin is cheap.”

Crypto market data daily view. Source: Coin360
The Reserve Risk indicator, which shows long-term holder sentiment, plunged to a new all-time low in July. According to commentator Murad, this means that “we are in the high timeframe bottoming zone” or that the indicator may be broken.
Will Bitcoin reverse course and begin a new rally, or will it continue to fall? Are altcoins showing signs of a bottom? Let’s look at the top five cryptocurrency charts to find out.
BTC/USDT
Bitcoin broke above the symmetrical triangle pattern on July 7, but the bulls were unable to sustain the momentum at higher levels. This indicates that the bears have not surrendered and are attempting to defend the overhead resistance at $23,363.
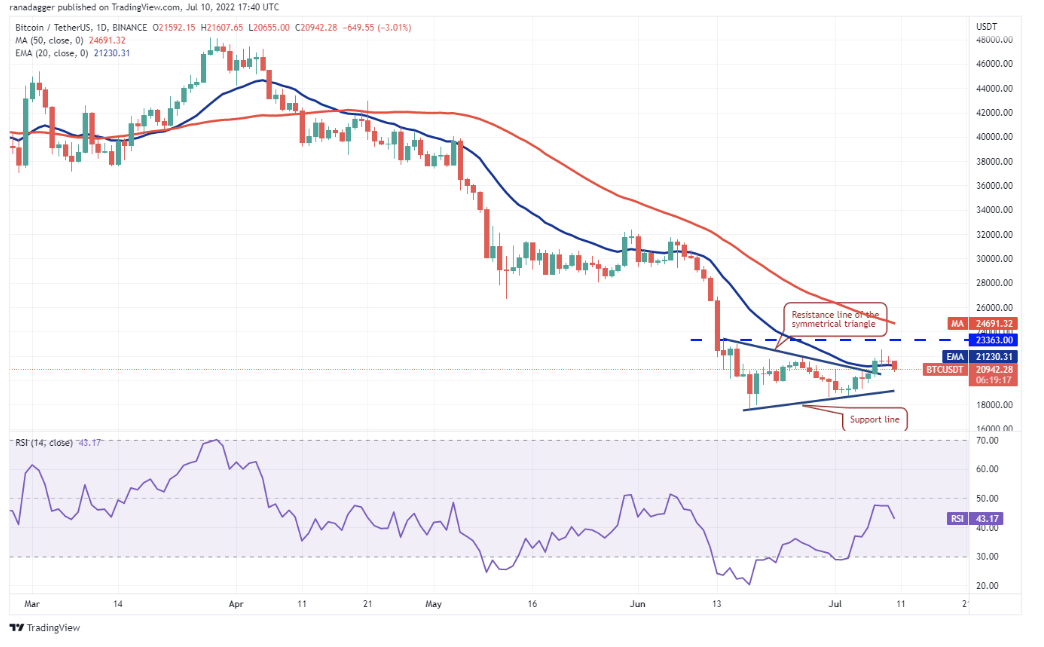
BTC/USDT daily chart. Source: TradingView
The bears are attempting to sustain the price below the 20-day exponential moving average ($21,230). If they succeed, the BTC/USDT pair may fall to the triangle’s support line.
If the price rebounds off this level, it will suggest that bulls continue to buy at lower levels. The bulls will again strive to push the price above the overhead resistance at $23,363 and the 50-day simple moving average ($24,692). If they succeed, it could signal the beginning of a new upward trend.
If the price falls below the support line, the bears will try to push the pair below $17,622.

BTC/USDT 4-hour chart. Source: TradingView
The bears pulled the price below the 20-EMA, but a minor positive is that the bulls are trying to defend the 50-SMA. This shows accumulation at lower levels. If bulls push the price back over the 20-EMA, the pair might reach $22,500.
Alternatively, if the price falls from the 20-EMA, the likelihood of a break below the 50-SMA increases, if that happens, the pair could extend its decline to $19,300. The flattening 20-EMA and the relative strength index (RSI) just below the midpoint do not give the bulls or bears a clear advantage.
UNI/USDT
Uniswap (UNI) broke above the overhead resistance at $6.08, completing a bullish inverse head and shoulders pattern. The bears are attempting to drive the price down below the breakout level.
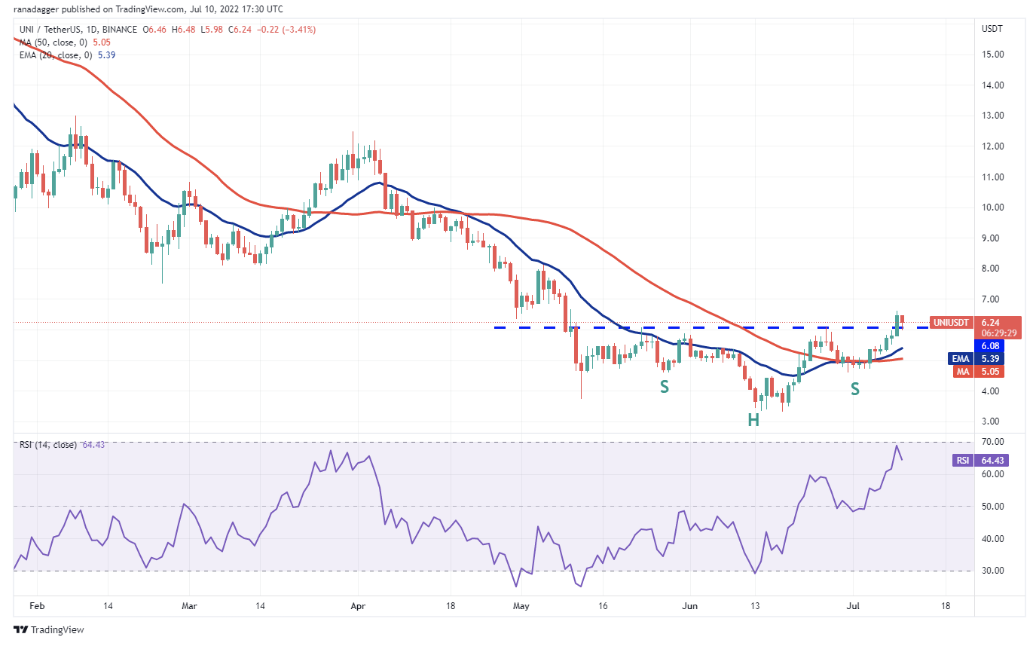
UNI/USDT daily chart. Source: TradingView
If they succeed, it will suggest that the rise above $6.08 may have been a bull trap. This could pull the price toward the 20-day EMA ($5.39). If the price rebounds off this level with strength, it could increase the possibility of a break above $6.62. The pair could then pick up momentum and rally toward the pattern target of $8.78.
If the price falls below the moving averages, it indicates that the bullish momentum has weakened. The UNI/USDT pair may then remain range-bound for a few days.

UNI/USDT 4-hour chart. Source: TradingView
The bears drove the price down to $6.08, but the strong rebound off the 20-EMA indicates aggressive buying at lower levels. The buyers will make another attempt to push the price above $6.62 and resume the uptrend.
If the price falls and breaks below the 20-EMA, it indicates that the bears are attempting to trap the aggressive bulls. The pair might then fall to the 50-SMA. If this level also cracks, the decline might reach $4.60.
ICP/USDT
Internet Computer (ICP) rose above the 50-day SMA ($6.48) on July 8, indicating that the bulls are seeking to form a bottom. The moving averages are nearing a bullish crossover, and the RSI is in the positive zone, indicating that the bears are losing ground.

ICP/USDT daily chart. Source: TradingView
If the price rebounds off the moving averages, it indicates that the bulls have turned the level into support. This might pave the way for a rally to the psychological level of $10, where bears may pose a strong challenge once again.
If, on the other hand, the price falls and breaks below the moving averages, it indicates that the bears are continuing to sell aggressively at higher levels. The ICP/USDT pair might then fall to $5, which is likely to act as a strong support.

ICP/USDT 4-hour chart. Source: TradingView
The long wicks on several candlesticks above $7 suggest that bears have not given up and are still selling on rallies. The bears dragged the price back below the 20-EMA, but the bulls aggressively purchased the dip. This suggests demand at lower levels.
The buyers are trying to drive the price above the 20-EMA. If they succeed, the pair may increase to $6.70 and then to $7.
Contrary to this assumption, if the price turns down from the overhead resistance and falls below $6.30, the pair may fall to the 50-SMA.
AAVE/USDT
AAVE’s recovery rose above the 50-day SMA ($79) on July 9, signalling a likely shift in trend. The 20-day EMA ($68) has started to turn up, and the RSI is in the positive zone, indicating that bulls are attempting to gain the upper hand.

AAVE/USDT daily chart. Source: TradingView
If bulls sustain the price above the 50-day SMA, the AAVE/USDT pair could pick up momentum and rally toward the psychological resistance at $100. This level may act as a strong hurdle, but if bulls arrest the subsequent decline above the 50-day SMA, it will suggest that buyers are back in the game. The pair could then attempt a rally to $120.
Contrary to this assumption, if the price remains below the 50-day, it suggests that bears will continue to sell on rallies. The bears will then try to lower the pair below the 20-day EMA and trap the aggressive bulls.
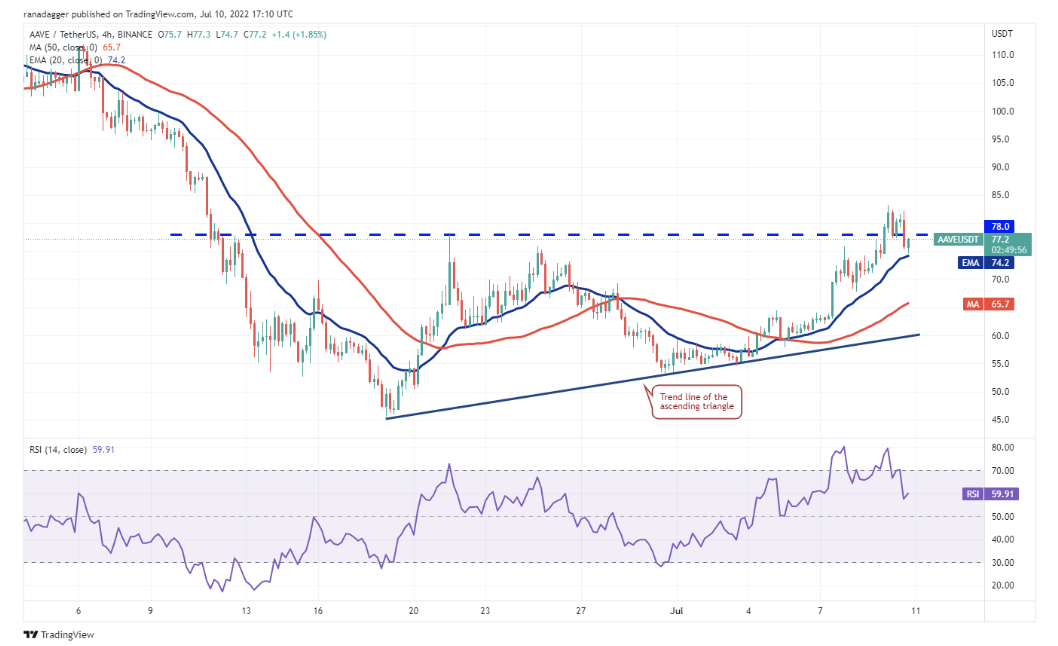
AAVE/USDT 4-hour chart. Source: TradingView
The 4-hour chart shows that the pair broke above $78, completing a bullish ascending triangle pattern. The bears pulled the price back below the breakout level, but a positive sign is that the buyers are defending the 20-EMA.
If the price increases and breaks above $83, the pair might pick up momentum and rally to $93. The pattern target of this bullish setup is $110.
The bears will have to push the price below the 20-EMA to invalidate this optimistic view. That could open the doors for a possible drop to the 50-SMA.
QNT/USDT
Quant (QNT) has risen sharply in the past few days, signalling that a bottom may be in place. The momentum picked up after buyers pushed the price above $67.

QNT/USDT daily chart. Source: TradingView
The moving averages have completed a bullish crossover, and the RSI is in the positive zone, indicating a possible trend change. The up-move is facing a strong hurdle near $90.
If the price turns down from this resistance but rebounds off the 20-day EMA ($64), it will indicate that sentiment has turned bullish and traders are buying dips. This could increase the likelihood of a rally to the psychological $100 level.
This positive view could invalidate the short term if the price falls further and breaks below $67.

QNT/USDT 4-hour chart. Source: TradingView
The sellers are attempting to stall the up-move at $90, but the upsloping moving averages and strong RSI signal that the bulls have the upper hand. If the price rebounds off the 20-EMA, the buyers could again push the price toward $90. A break and close above this resistance could indicate that the short-term uptrend has resumed.
This optimistic view could be invalidated in the near term if the price turns down and breaks below the 20-EMA. The pair could then decline to the 50-SMA.


